The Strongest Backbone for Enterprise Decision Support
As enterprises grow, business activities and operational data become increasingly complex. Issues that could initially be handled through manpower and basic documentation tools gradually accumulate into large volumes of data, requiring more powerful information systems to reduce reliance on human resources when consolidation or inquiry is needed.
Real-time visibility into operations and systematic trend analysis enable faster and more effective decision-making. This represents the hidden value of enterprise digitalization—reducing manpower and operational costs while gaining critical decision-making time.
Enable Better Business Decisions with BI EE
Through Oracle performance management systems and Oracle Business Intelligence Enterprise Edition (Oracle BI EE), enterprises can perform data analysis in the most timely, accurate, and comprehensive manner. Information is extended to executives, managers, and frontline employees through personalized, interactive intelligence dashboards, offering targeted analysis and queries, predictive insights, alerts, advanced reporting, and forecasting—enabling faster and clearer business decisions.
Functional Overview by Role
-
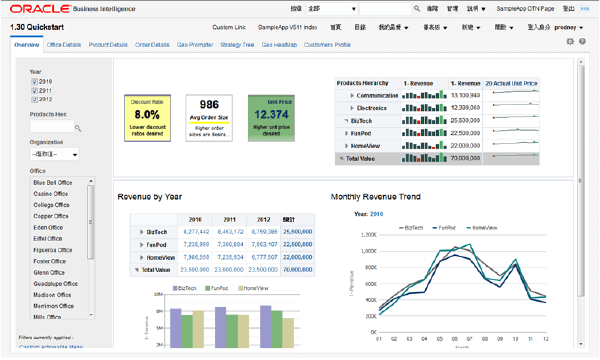
Executive Command Center
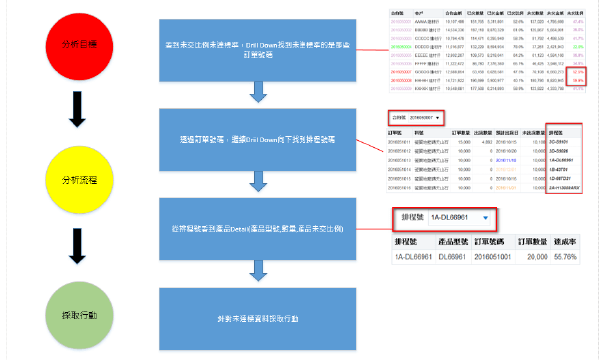
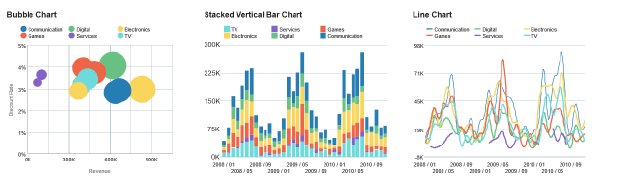
The system integrates multiple reports and charts into a single view, using visual indicators such as charts and status lights to give executives a complete overview of key information in a short time. When anomalies are detected, executives can use drill-down functionality to instantly query more detailed data online, identify root causes, and make better execution decisions.
-
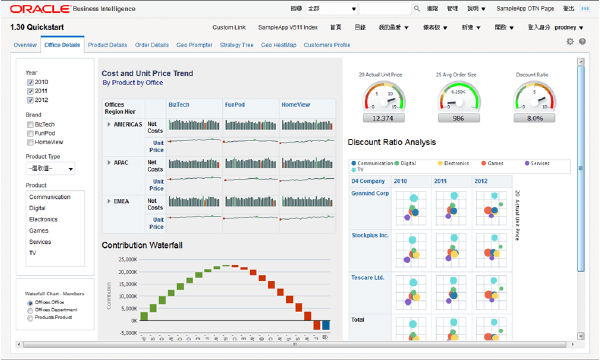
Regional Operational Performance Indicators
The system provides management reports and charts to monitor operational performance by region, track goal achievement, and leverage advanced analytics to create custom reports, identify potential issues, and formulate solutions.
-
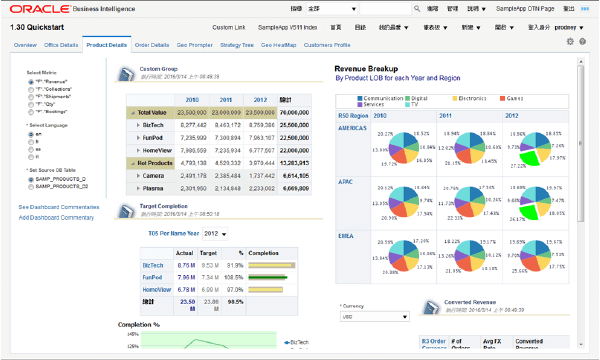
Sales Reports
With various reports available, users can query their sales performance and results online at any time, understand target achievement, and identify areas for improvement without waiting for delayed information from IT staff.

Implementation Benefits
Gain insight into internal performance, processes, and customer evaluation metrics
- Compare actual results with plans in real time
- Provide management with key indicators for decision-making
- Drive revenue and profit growth through improved goal management
Aligned Cross-Department Strategy and Execution
- Manage and execute functions across all levels using unified and complete data and KPIs
- Enhance efficiency and reduce costs by maintaining product quality and customer satisfaction
- Identify and replicate best operational models
- Provide predictive simulation analysis
Maximize Existing Data, Systems, and IT Investments
- Unlock data value faster with lower cost and risk
- Shorten data collection time and unify information sharing