
Business Intelligence System (BIS)
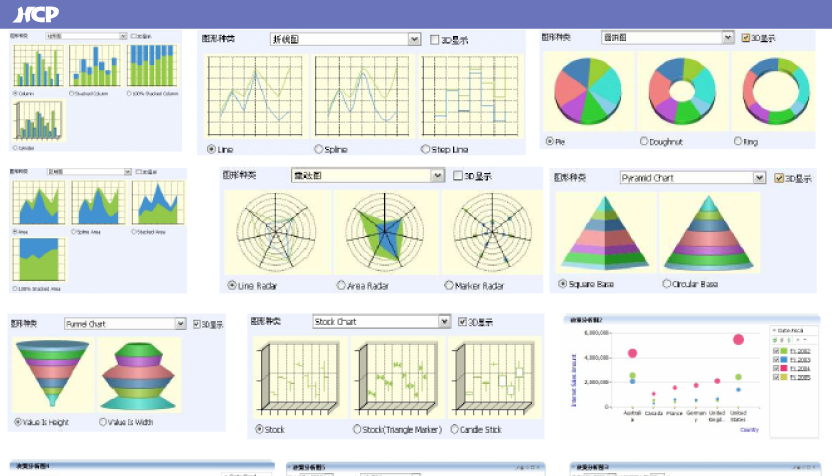
HCP integrates with Analyzer business intelligence software to deliver a Business Intelligence System (BIS) designed specifically for HR teams. With 25 dimensions and 20 measures, users can freely drag and combine multidimensional analytical reports, supported by a wide range of visual analytics tools. Reports can be generated in as little as 30 seconds and are accessible on mobile devices, enabling HR and IT teams to produce insights effortlessly.
Managers can access the BIS system at any time to review enterprise-wide metrics and workforce allocation by department. The system provides 58 KPI indicators, and through Workforce Competence analysis, it can predict the types of talent required for each department to achieve targets, as well as priorities for the next phase of training and development. By analyzing organizational capabilities through the Business Intelligence System, enterprises gain timely, high-value operational insights that strengthen overall competitiveness.
How can enterprises use the Business Intelligence System
to quickly obtain valuable
HR operational insights?
-
-
Analyze HR Reports by Freely Dragging and Combining Dimensions and Measures
The system includes at least 25 dimensions and 20 measures. Dimensions cover employee data, plant information, payroll items, and overtime data, while measures include working hours, costs, overtime pay, and salary amounts. Through flexible drag-and-drop operations, HR teams can generate analytical reports independently without relying on IT staff to write code.
-
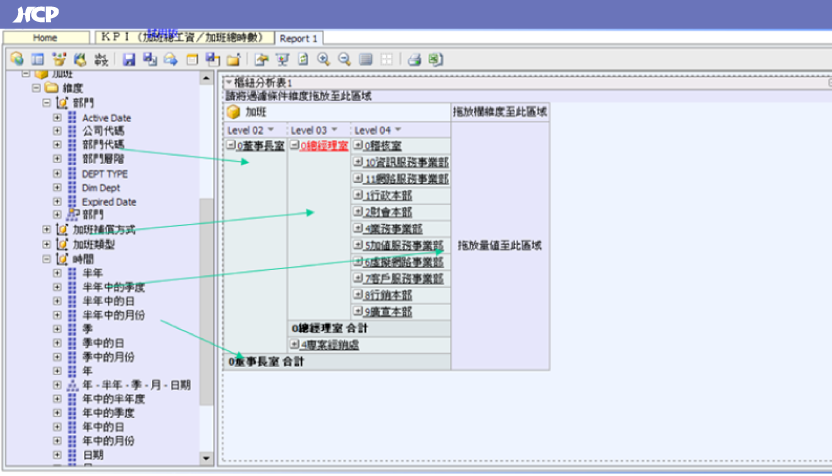
Analyze HR Reports by Freely Dragging and Combining Dimensions and Measures
The system includes at least 25 dimensions and 20 measures. Dimensions cover employee data, plant information, payroll items, and overtime data, while measures include working hours, costs, overtime pay, and salary amounts. Through flexible drag-and-drop operations, HR teams can generate analytical reports independently without relying on IT staff to write code.
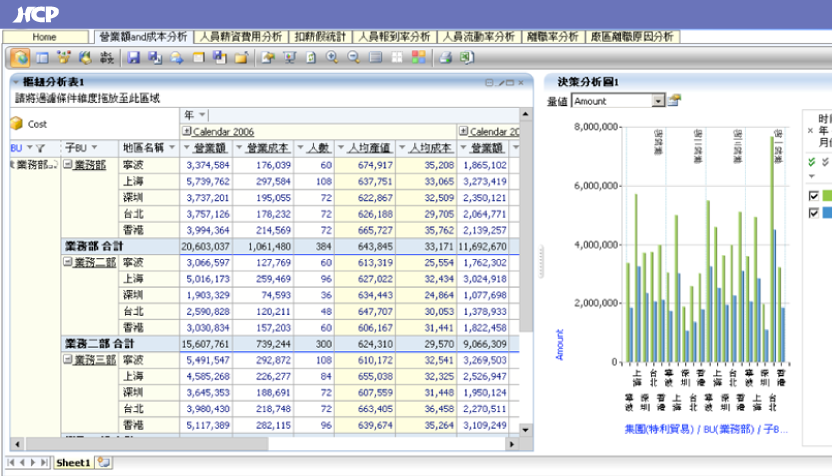
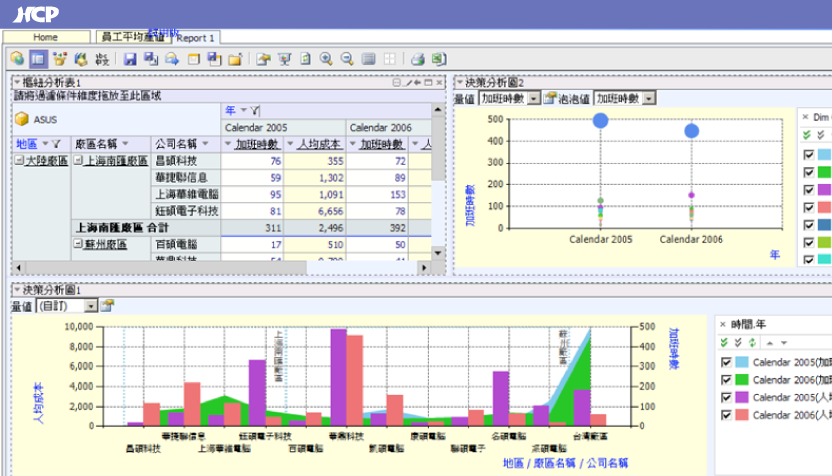
Quick Workforce Cost Analysis Across Business Locations
Analyze workforce and operational data across subsidiaries or locations, including headcount, revenue per employee, cost per employee, revenue, and operating costs
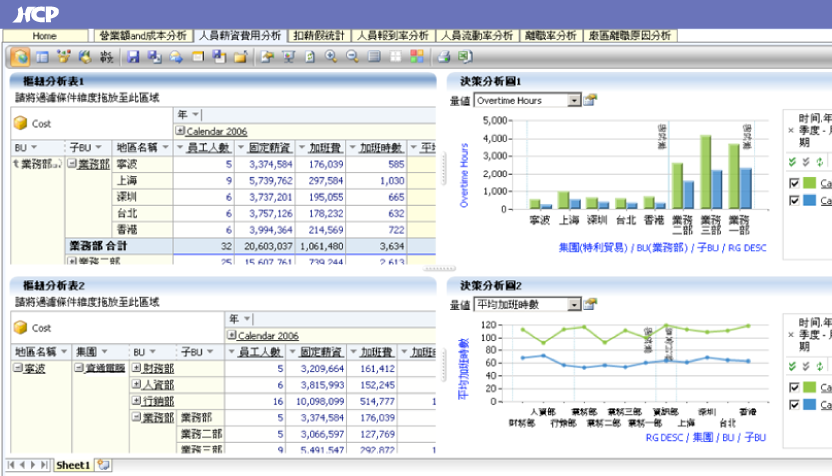
Comprehensive Workforce Salary Cost Analysis
Includes headcount, base salary, overtime pay, overtime hours, and more
Visualized Salary-to-Performance Ratios to Support HR and Business Strategy Optimization
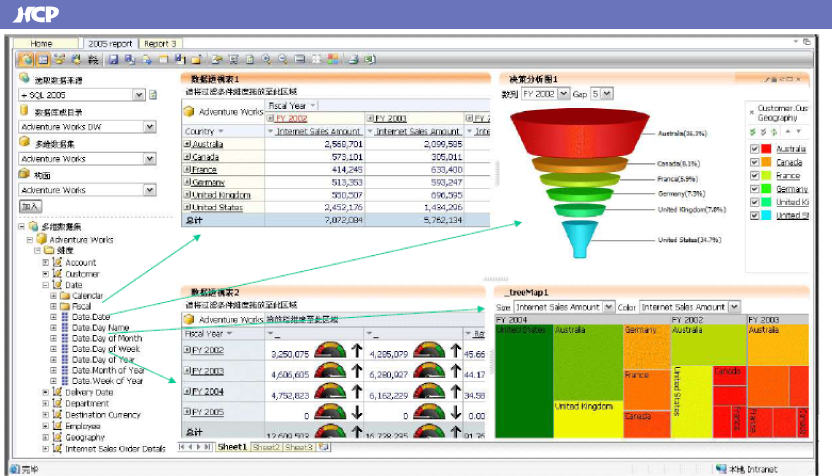
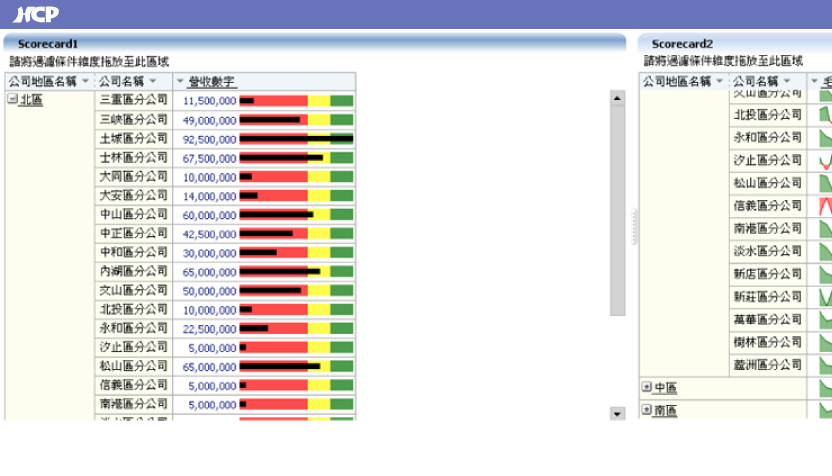
Company Performance Becomes Instantly Visible Through Pivot Tables and Visualizations
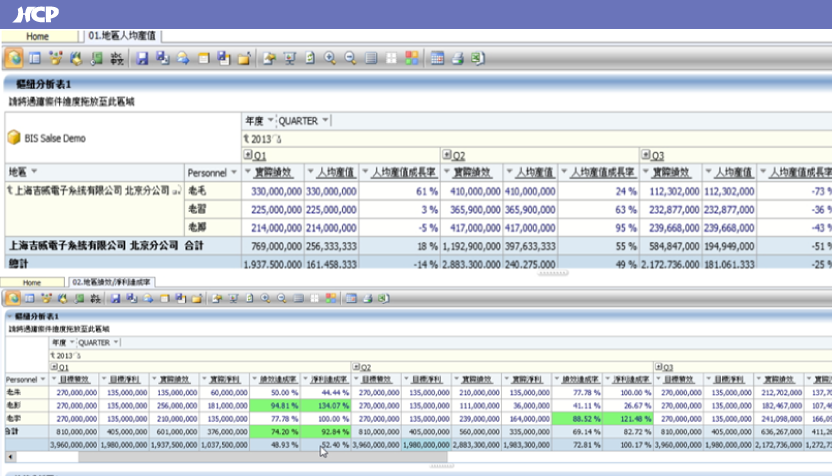
Provides Regional Revenue per Employee and Performance/Net Profit Achievement Rates
Track Target vs. Actual Performance Achievement at the Individual Level
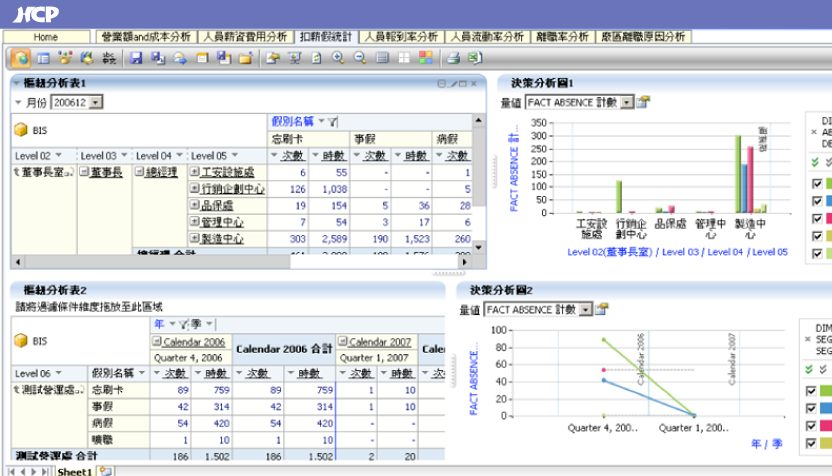
Attendance and Leave Statistics, Including Unpaid Leave Deductions
Track Leave Usage and Attendance Hours Across Business Units
-
-
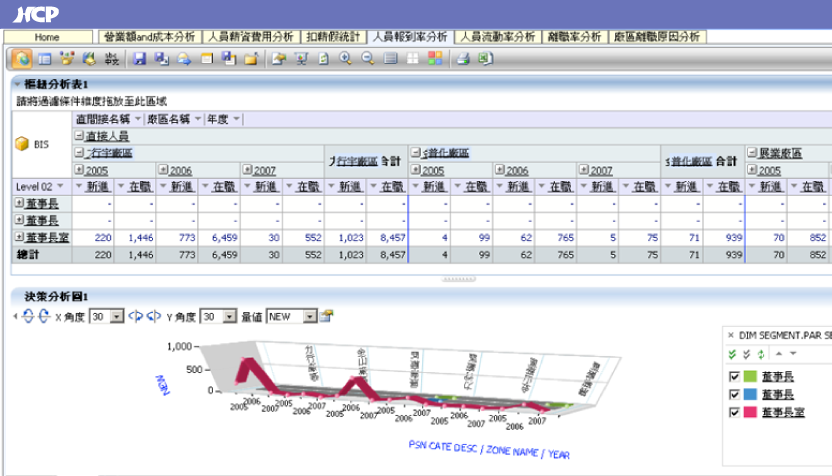
Employee Onboarding Rate Analysis
New Hire Onboarding Rate Analysis
-
Employee Onboarding Rate Analysis
New Hire Onboarding Rate Analysis
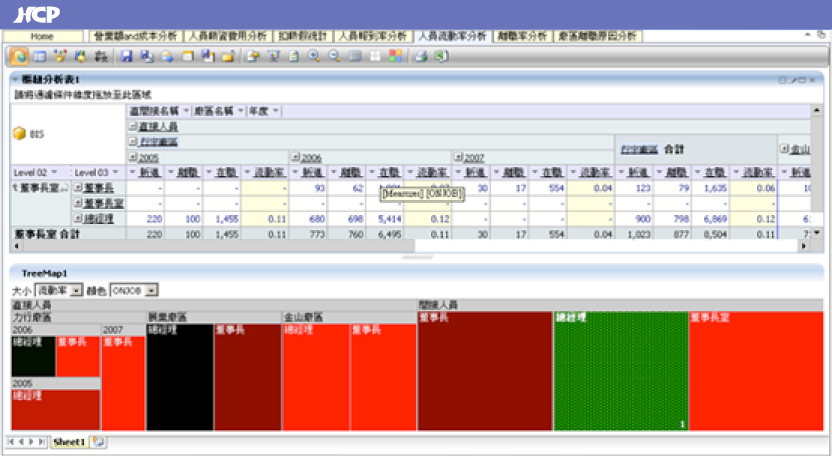
Workforce Turnover Analysis
Analyze Active vs. Resigned Employee Ratios
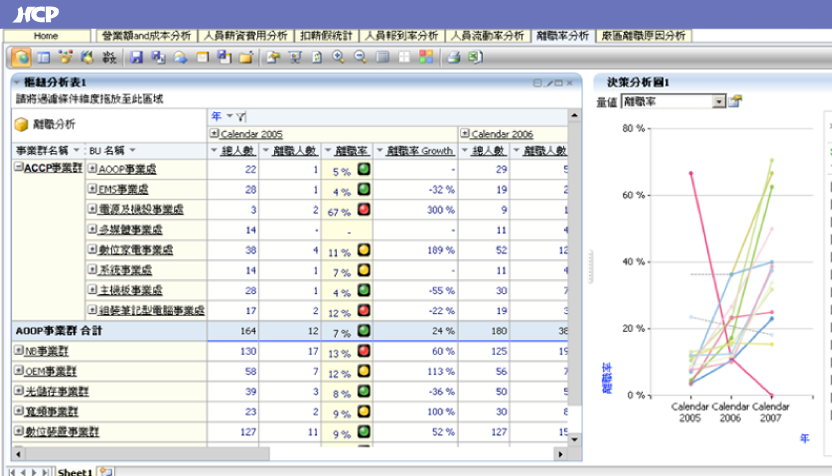
Attrition Rate Analysis
Analyze Attrition Rates Across Business Units
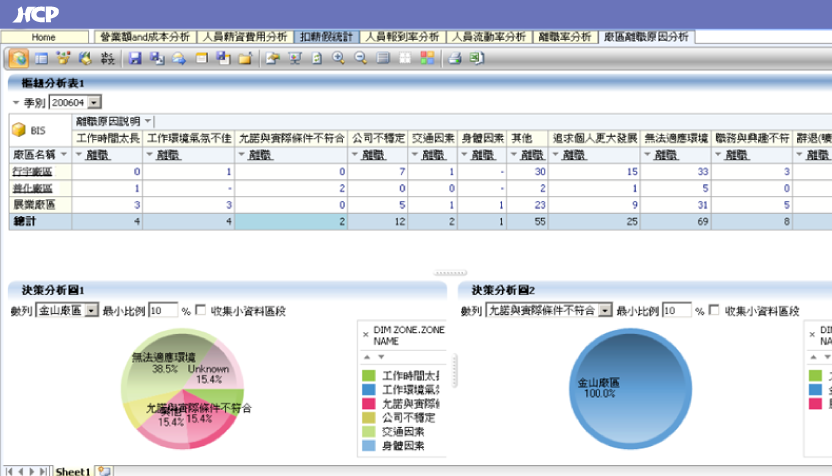
Resignation Cause Analysis by Site
Analyze Reasons for Resignation Across Business Units
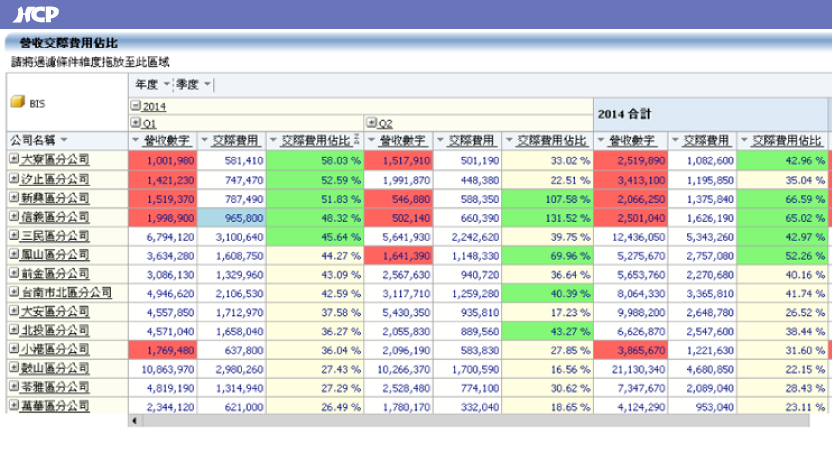
Revenue and Expense Analysis
Includes revenue figures, entertainment expenses, and expense ratios
-
-
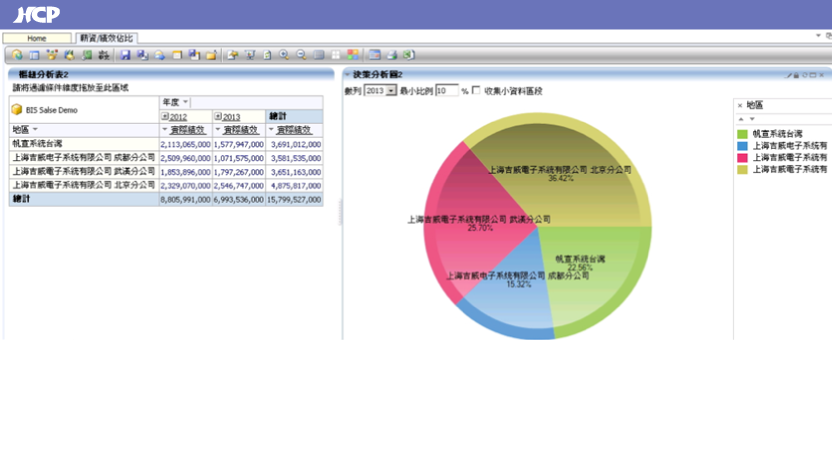
Revenue and Net Profit Analysis
Color-coded visualization of revenue and profit by subsidiary
-
Revenue and Net Profit Analysis
Color-coded visualization of revenue and profit by subsidiary
HR Report Generation
Convert Key Metrics into Structured Analytical Reports

Color Gradient Segmentation
Customize Gradient Colors to Highlight Key Report Insights

Export Reports to Excel
Export and Save Reports as Files

Send Reports via Email
Send Reports Directly via Email